GridPIQ displays load duration curves on the project results page for the pre- and post-project load profiles. The image below is one example from a photovoltaics project.
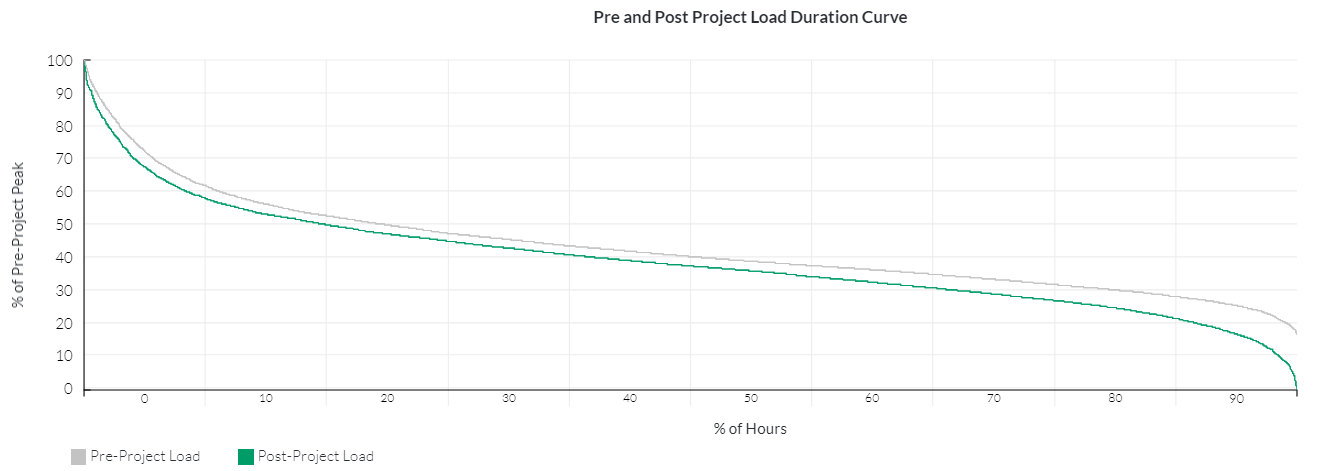
The y-axis represents percentage of pre-project maximum power, and the x-axis represents percentage of total hours. Values plotted are sorted in descending order.