The conservation voltage reduction (CVR) module estimates the first-order impacts of reducing system voltage in order to conserve energy. Some electrical loads (like an incandescent light bulb) consume less energy when operated at a lower voltage without a noticeable decrease in device performance. Energy reduction from CVR varies hour to hour based on electrical system conditions such as load composition, system voltage, power factor, etc. In fact, sometimes reducing system voltage can actually increase overall energy consumption. Pacific Northwest National Laboratory estimates that if implemented on a national scale, CVR could save approximately 3% of electrical energy consumption. More details on this study and on CVR in general can be found in this PNNL report.
Objective
The objective of the CVR module is to model the reduction (or increase) of load at every hour and in aggregate from a CVR program.
Methodology
The CVR module is executed in several steps, which are depicted in the process flow diagram provided below. It shows how the module components process all data to determine the impacts of the user-specified project.
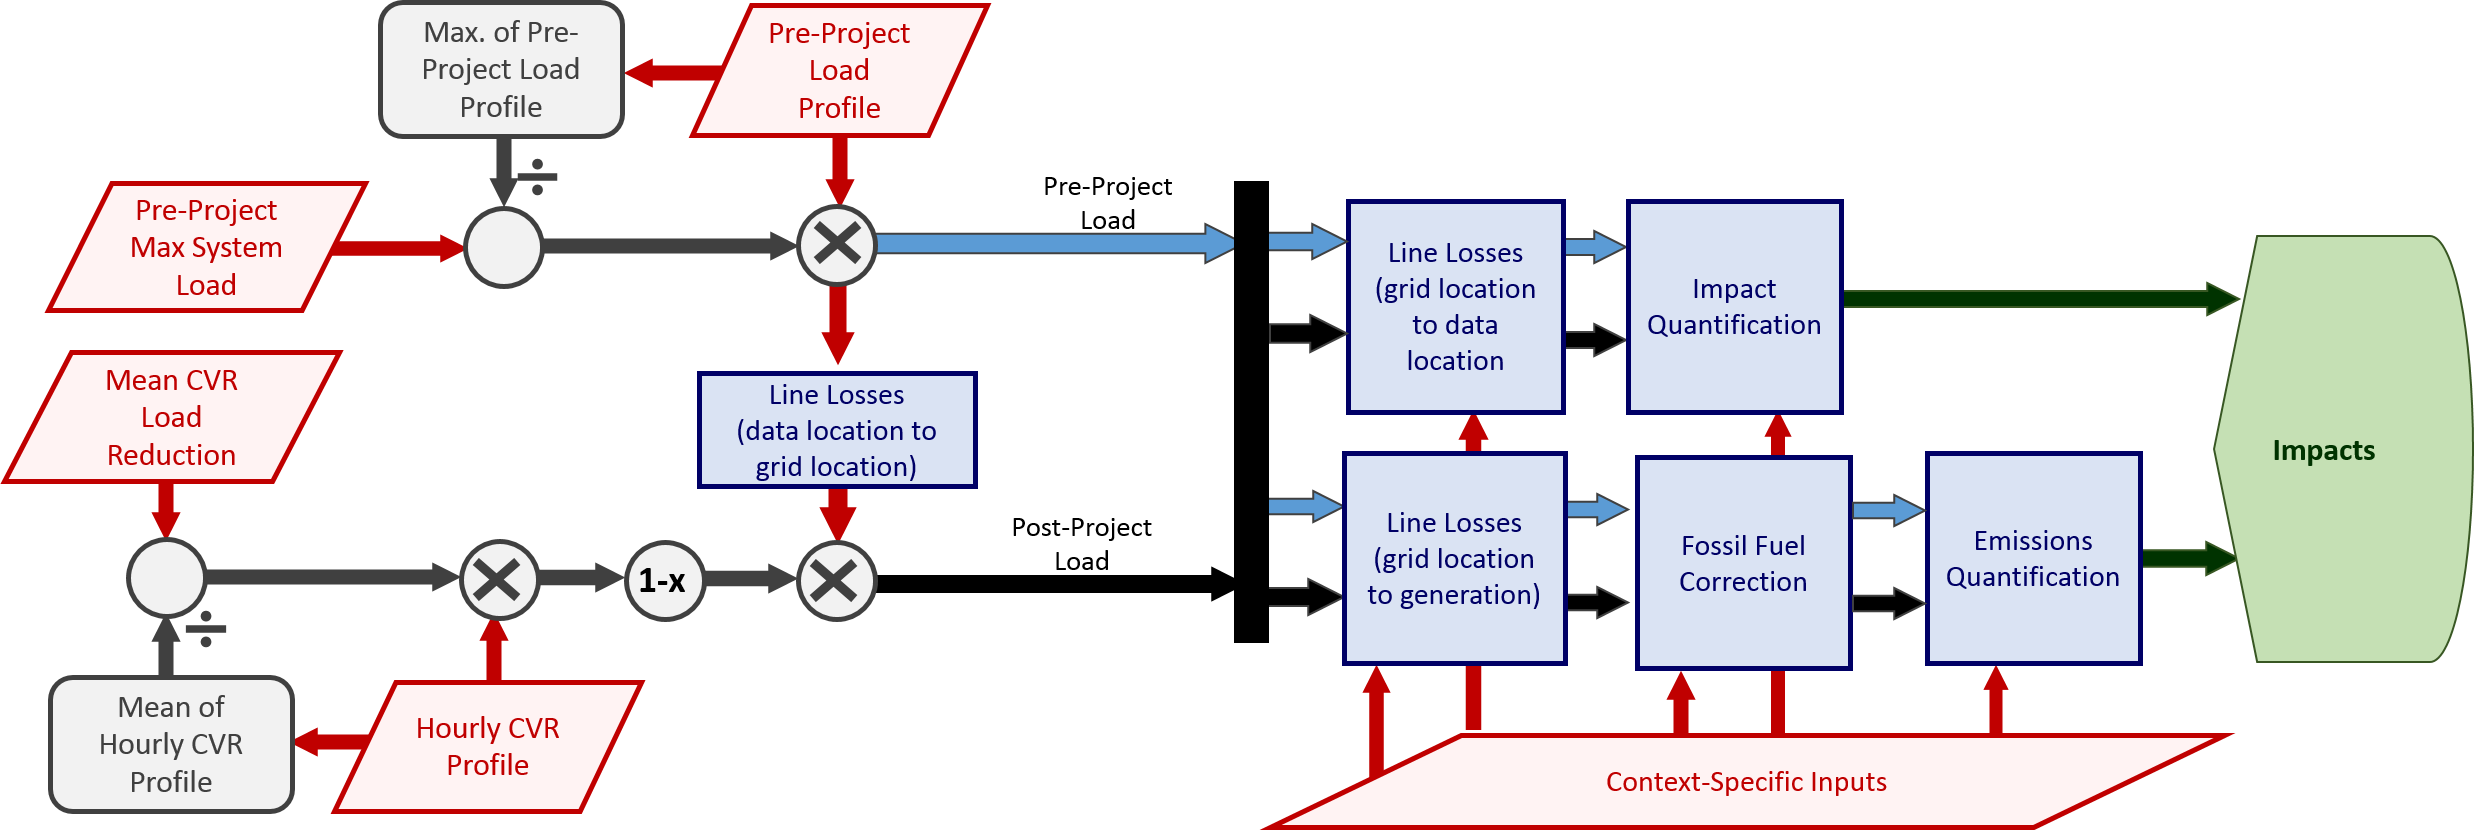
Users supply the information necessary to place the project within its appropriate context, including region, baseline load profile, system size, etc.
The selected hourly CVR profile indicates how much energy conservation is possible at each hour. The shape of this profile is mandated by system conditions. As a simple thought experiment, imagine an electric distribution feeder in a very cold region during the winter time. It's cold, so people are running their heaters. In this simple scenario, assume all heaters are resistive in nature (e.g. baseboard heaters as opposed to a gas furnace or heat pump). Since the heaters are controlled by a thermostat, they will run until the residence is at the desired temperature. Reducing system voltage will cause the heaters to use less power, but run for a longer time to output enough energy to heat the building. In this example, approximately the same amount of energy is used with and without CVR. However, during a different time of the year, the feeder's load composition may be conducive to CVR and create energy savings.
GridPIQ provides sample CVR profiles that were created by replicating the experiment described in this PNNL report. A set of prototypical distribution feeder models (described here, and found here) in GridLAB-D™ format were modified to include models of buildings, HVAC systems, water heaters, and end-use loads. These models were then simulated in GridLAB-D™ with and without a conservation voltage reduction control scheme. The resulting hourly energy consumption from each feeder was weighted and added to a regional energy time-series. Finally, the regional hourly percent change in energy consumption between the base case (no CVR) and the CVR case was computed. These regional profiles are the sample CVR profiles provided by GridPIQ.
It's important to note that CVR is a complex issue. GridPIQ does not model the electrical details of your system, but rather uses anticipated hourly energy reduction to quantify impacts from CVR.
After an hourly CVR profile has been selected or uploaded, the profile is scaled so that the mean of the shifted profile is equivalent to the desired mean value provided by the user. In this way, the shape of the profile is maintained, but the scale of reductions (or increases) is different.
After the pre-project load profile has been mapped from the project’s data location to the grid location and a scaled hourly CVR profile has been created, GridPIQ subtracts each hourly value from one (e.g. 1 – 0.03 = 0.97), and then multiplies the resulting profile by the pre-project load profile (as depicted in the flow chart above). This creates the post-project load profile. From there, impact quantification based on project context proceeds as normal.