The electric vehicles technology algorithm computes the impact on the system load of the addition of electric vehicle charging to the grid and can be modeled for either uncoordinated electric vehicle (EV) charging behavior or for a coordinated charging scheme. Electrical demand associated with either uncoordinated EV charging or coordinated charging is added to the pre-project load profile. For uncoordinated EV charging, the profile is based on a user-uploaded charging profile that represents average EV charge behavior throughout the day. For coordinated charging, a valley-filling algorithm is applied to the user-uploaded profile, which shifts charging load to the lowest demand times within the user-selected allowable charging window. Because the charging behavior of the EVs is influenced by knowledge of the larger system load, the charging scheme is said to be “smart.”
The electric vehicles technology in GridPIQ can be used to explore several different types of use cases and would require user entry of different parameter values, accordingly. For example, if a user were trying to understand the additional charging load and resultant emissions of a state-based EV rebate program, they would choose a load profile shape and peak load applicable to that state and a charging profile representative of the vehicles to be included in the rebate program. If a user wanted to examine the impacts of operating charging stations with coordinated versus uncoordinated charging, they would have to run two different simulations – one with the coordinated option and one with the uncoordinated option – and compare the post-project results of the two simulations. Users would also enter different information if studying commercial versus passenger vehicles, with the number of new vehicles and charging profiles appropriate to each type.
Objectives
The electric vehicles technology allows for two objectives:
- Uncoordinated EV charging
- Coordinated EV charging (smart-charging)
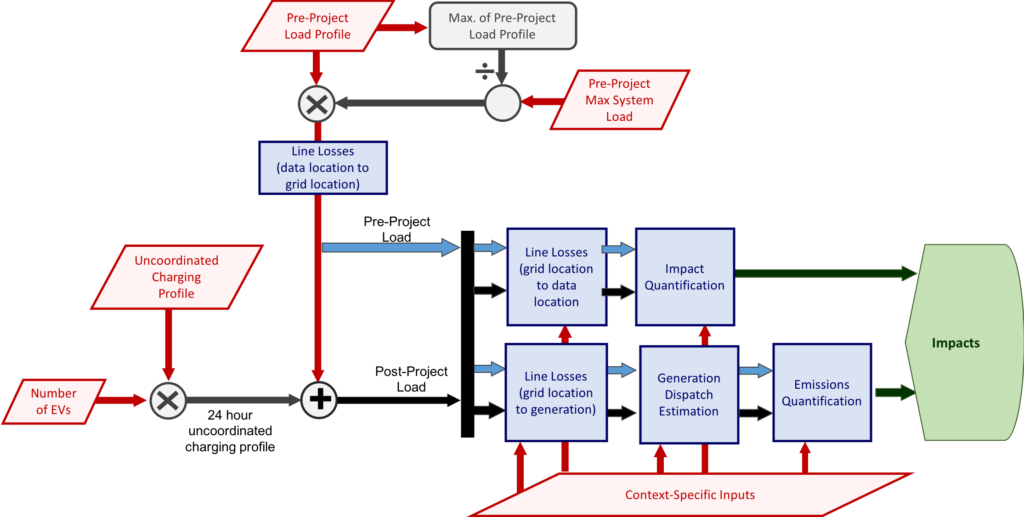
The uncoordinated EV charging objective simply adds additional load to the pre-project load profile based on the user specified charging profile and number of vehicles. The workflow for uncoordinated charging is shown in the figure below.
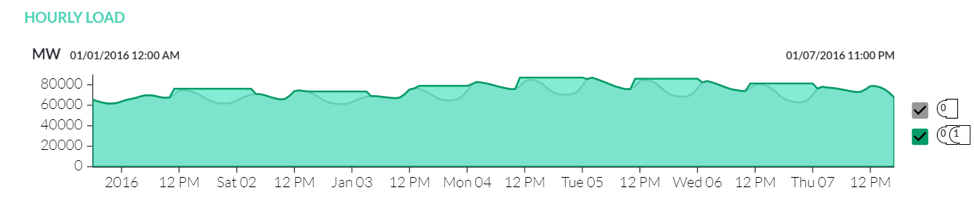
The coordinated EV charging objective shifts EV charging load to periods of lower grid demand in the allowable charging window. The figure below provides an example for how load is shifted with this objective. In this scenario, the coordinated allowable charging window is from 5 p.m. to 7 a.m. on weekdays and 8 p.m. to 10 a.m. on weekends. The labels ‘0’ and ‘0, 1’ correspond to pre-project load and post-project load, respectively.
Methodology
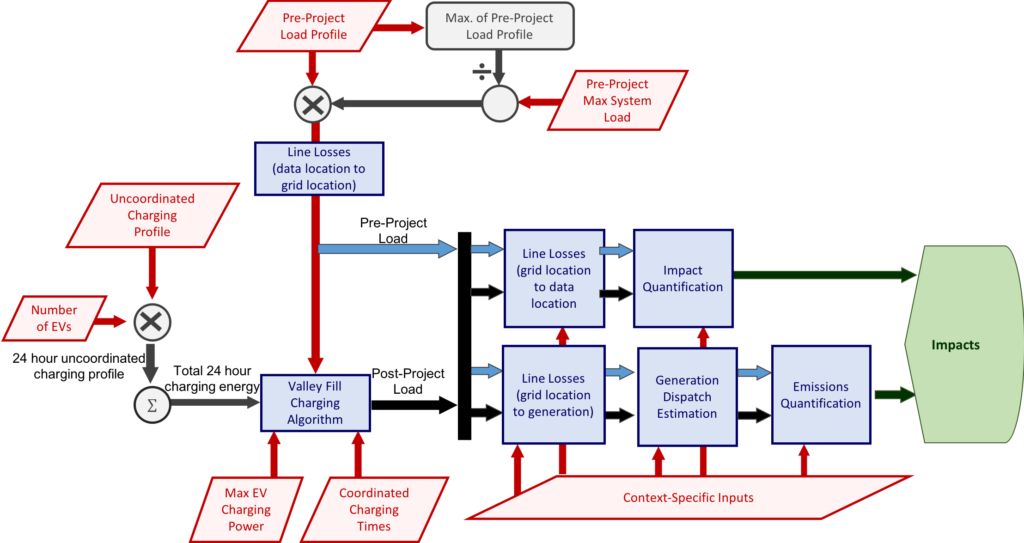
The smart-charging objective is executed in several steps, which are depicted in the process flow diagram provided below. It shows how the module components process all data to determine the impacts of the user-specified project.
Users supply the information necessary to place the project within its appropriate context, including region, baseline load profile, system size, etc.
EV Charging Profile
The profiles shown in the figure below come from the Alternative Fuels Data Center Electric Vehicle Infrastructure Toolbox. This toolbox allows users to estimate charging behavior at different types of chargers (home, work, fast chargers) while toggling inputs such as city, number of EV vehicles, and average miles traveled per vehicle. Data from this toolbox were used to create EV charging profiles from four different cities.

Number of EVs
Users provide the estimated number of electric vehicles to be added to the system. This quantity is used to scale both the per electric vehicle charging profiles and the maximum charge power in order to represent the entire fleet of electric vehicles.
Reference Information
The reference information displayed comes from the Alternative Fuels Data Center Vehicle Registration Counts by State and indicate the number of vehicles (both EV and conventional) registered in each state. The information is disaggregated into three tiers:
- United States
- Region
- State
The data can be found here:
Post-Project Load for the Uncoordinated EV Charging Objective
To develop the uncoordinated electric vehicle charging load, the hourly EV charging load profiles (per vehicle, typical weekday and typical weekend) are first multiplied by the number of EVs. Next, the weekday and weekend profiles are appropriately replicated and concatenated for the project date range to form a total hourly uncoordinated EV-only load. The post-project load profile for the uncoordinated EV charging objective is simply the hourly sum of the pre-project load profile (original user input), and the uncoordinated EV-only load profile.
Maximum EV Charging Power
Users provide the effective maximum rate of charging (kW) for the average EV within the fleet of vehicles participating in coordinated charging. This input multiplied by the chosen number of EVs defines the effective maximum charging power for the fleet of EVs under consideration. For an individual EV, this value is limited by the power rating of the charging device or the charge acceptance rate of the EV’s battery. A common battery acceptance rate is 3.3 kW, while charger power outputs can vary widely.
The maximum DC fast-charging power of the most common 20 EV models sold as of 2024 and the charging power for typical Level 1 and 2 chargers are provided on the number line for reference. Only a single charging power can be selected. Therefore, this parameter represents an estimated average value for the fleet of EVs.
Reference Information
GridPIQ provides reference maximum fast-charging values for the top 20 EV models seen on the road as of 2024. The number of total cars sold of each model was found by looking up each individual model at Good Car Bad Car. The maximum fast-charging power for each model was found in various sources that are listed below. For some of these models, there are different batteries that may be installed with different charging limits, so the maximum among all charging limits found was used here. The following sources provide information on EV charge rates:
- https://evbox.com/en/electric-cars/tesla/tesla-model-y
- https://evbox.com/en/electric-cars/tesla/tesla-model-3
- https://www.zap-map.com/ev-guides/model-charging/ford-mustang-mach-e
- https://evchargeplus.com/ev-specification/chevrolet-bolt/
- https://pod-point.com/guides/vehicles/tesla/2022/model-s
- https://evbox.com/en/electric-cars/tesla/tesla-model-x
- https://evbox.com/en/electric-cars/hyundai/hyundai-ioniq-5
- https://media.vw.com/en-us/releases/1781
- https://ev-database.org/car/3030/Kia-EV6-Standard-Range-2WD
- https://rivian.com/experience/charging
- https://www.evspecs.org/tech-specs/ford/f-150-lightning/standard-range
- https://evadvisors.com/nissan-improves-range-power-performance-charging-speed-of-all-electric-leaf-e/
- https://www.bmw.com.mt/en/all-models/m-series/m440i-xdrive-gran-coupe/bmw-m440i-xdrive-gran-coupe-technical-data.html/bmw-i4-m50-xdrive-gran-coup%C3%A9.bmw
- https://pod-point.com/guides/vehicles/ford/2023/e-transit
- https://ev-database.org/car/1666/Kia-Niro-EV
- https://www.mbusa.com/en/vehicles/model/eqe/sedan/eqe350v
- https://ev-database.org/car/1833/Kia-EV9-761-kWh-RWD
- https://www.mynissan.org/charge-range-battery
- https://www.campchevrolet.com/chevrolet-research/chevy-blazer-ev-charging-time-range/
Allowable Charging Times
The coordinated charging period for weekdays and weekends need to be defined. The charge start time (t1) indicates when the vehicles are plugged in to begin charging, and the charge end time (t2) indicates the time when all the vehicles must be fully charged. Default coordinated charge times are defined to be 5 p.m. to 7 a.m. on weekdays, and 8 p.m. to 10 a.m. on weekends. For usability, EVs are required to be fully charged by the end of a given charging period. If the combination of charging duration and EV maximum charge power (pmax) creates a situation in which all EVs cannot fully charge, an error will be thrown. From the load profile containing uncoordinated EV charging, for each 24-hour period, the required EV charging energy (c) is determined. In the post-project scenario, equivalent charging is performed using a valley-filling algorithm during the user-selected charging period.
Valley-Filling Algorithm
The time series input to the valley-filling algorithm is the pre-project (\(p\)) load plus uncoordinated EV charging. It is assumed that each time series value is an average for the given hour, so translating from power (MW) to energy (MWh) is as simple as multiplying by one hour. The charging energy per EV for each day is determined by integrating the correct charge profile (weekday or weekend, as applicable), and it is multiplied by the number of EVs to obtain the energy to be valley-filled for that day. The per EV maximum charge power has been earlier specified by users, and it is multiplied by the number of EVs to obtain the maximum power input to the valley-filling algorithm. The tolerance (\(\epsilon\)) defaults to 0.001, which translates to 1 kWh in this case.
This algorithm implements valley-filling on a one-dimensional array between two given indices. Here, the input array is a time series of power values, and the amount of fill is the charging energy (power x time). The valley-filling algorithm will create a flat lake in the valleys if the applied constraints allow it to do so. The charging start and end times (provided by the user) constrain where in the one-dimensional array filling is allowed to occur. The max-power value defines the maximum amount by which the height of the valley can be increased. A finite value of max-power can result in the lake following the bottom of the valley instead of creating a flat surface. In the event that there is a large charging load and the allowable charge time is short or occurs when demand on the system is already high, new peaks may be created in the post-project load.
The appropriate fill height is determined by an iterative bisection method. During each iteration, the algorithm tracks any points in the array that cannot be further filled due to max-power restrictions. The iterations are stopped when the amount of energy used in filling and the amount of fill-energy specified by the user are within the specified tolerance, or when the maximum number of iterations have occurred. If the maximum number of iterations is not specified, it defaults to 100 for both of the while loops as depicted in the valley-filling algorithm process flowchart below.
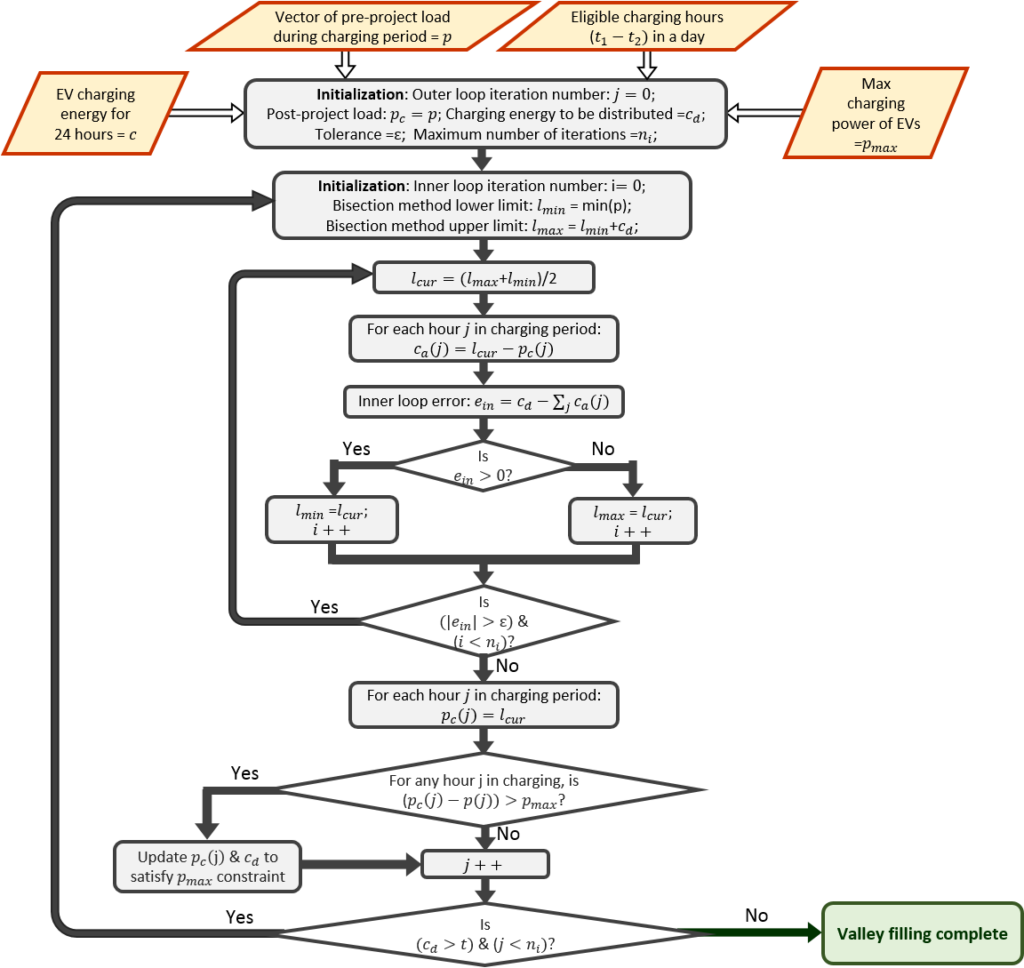
Note that any day that does not start at midnight at the beginning or end of the given load profile will be excluded. The charge profile will not be added to the pre-project load and the valley-filling will not be performed on those partial days.
References
- https://energy.gov/eere/vehicles/avta-ev-project
- http://api.census.gov/data/2014/
- http://www2.census.gov/programs-surveys/acs/tech_docs/subject_definitions/2014_ACSSubjectDefinitions.pdf
- http://www.afdc.energy.gov//data//10567
- http://ieeexplore.ieee.org/stamp/stamp.jsp?arnumber=6280677
- http://evobsession.com/electric-car-charging-101-types-of-charging-apps-more/