Defining the baseline pre-project load has two steps: choosing the shape and the magnitude of the load profile.
Pre-Project Load Profile
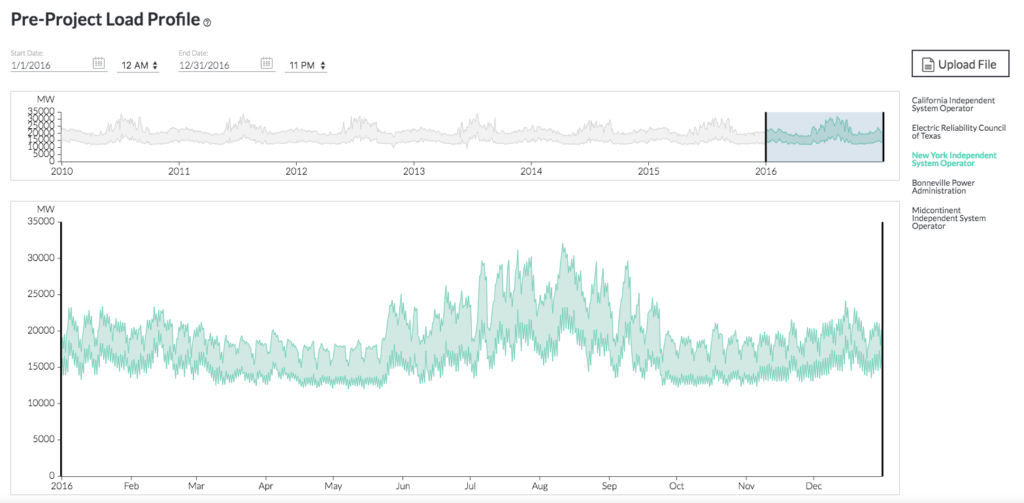
The pre-project load profile establishes the baseline against which post-project load shape changes are compared. Users are encouraged to upload their own pre-project load profiles, but for those who may not have access to an appropriate load profile, some regional options have been made available. The profiles provided through the website include a selection of different utilities and ISOs. Users will have the opportunity to scale the selected profile to a new peak value. This allows users to select an appropriate load shape and then scale it to a size that reflects their system.
Reference
The provided regional profiles were obtained from the following sources:
After downloading the data, load profiles were cleaned by filling in missing data via linear interpolation and resampling to an hourly timeframe (if necessary).
Pre-Project Maximum System Load
The pre-project maximum system load step gives users the opportunity to scale their selected load profile to reflect the size of the system under investigation. Scaling is done linearly based on peak demand values. In other words, each hourly value is multiplied by the ratio between the selected pre-project maximum system load and the peak demand of the load profile being scaled.
The reference values provided in the pre-project maximum system load selection step are derived from Air Markets Program Data (AMPD). Hourly generation was taken from each electric generating unit (EGU) that reported to the AMPD in 2014, a requirement for EGUs with a nominal generating capacity of 25MW or larger. These hourly unit data were then mapped using unique plant identifiers to their system operator, balancing authority and North American Electric Reliability Corporation (NERC) region using plant identification information provided by the Energy Information Administration (EIA). What is presented here is therefore a selection of the peak annual hourly fossil fuel generation values for EGUs of 25MW or greater aggregated by plant, system operator, balancing authority and NERC region.
For each NERC region, three balancing authorities were selected for display – those with the minimum, median, and maximum peak fossil fuel generation for the given NERC region. If there is an even number of balancing authorities for a given NERC region, the one with the value closest to the median was selected. The same process was used for system operators within balancing authorities and plants within system operators.